# defined estimator of Y_tildeY_tilde <-function(y) { (1/(length(y)-1))*sum(y)}# get 5 observations from N(10,25)observations <-rnorm(5, mean =10, sqrt(25))Y_tilde(observations)
[1] 12.40891
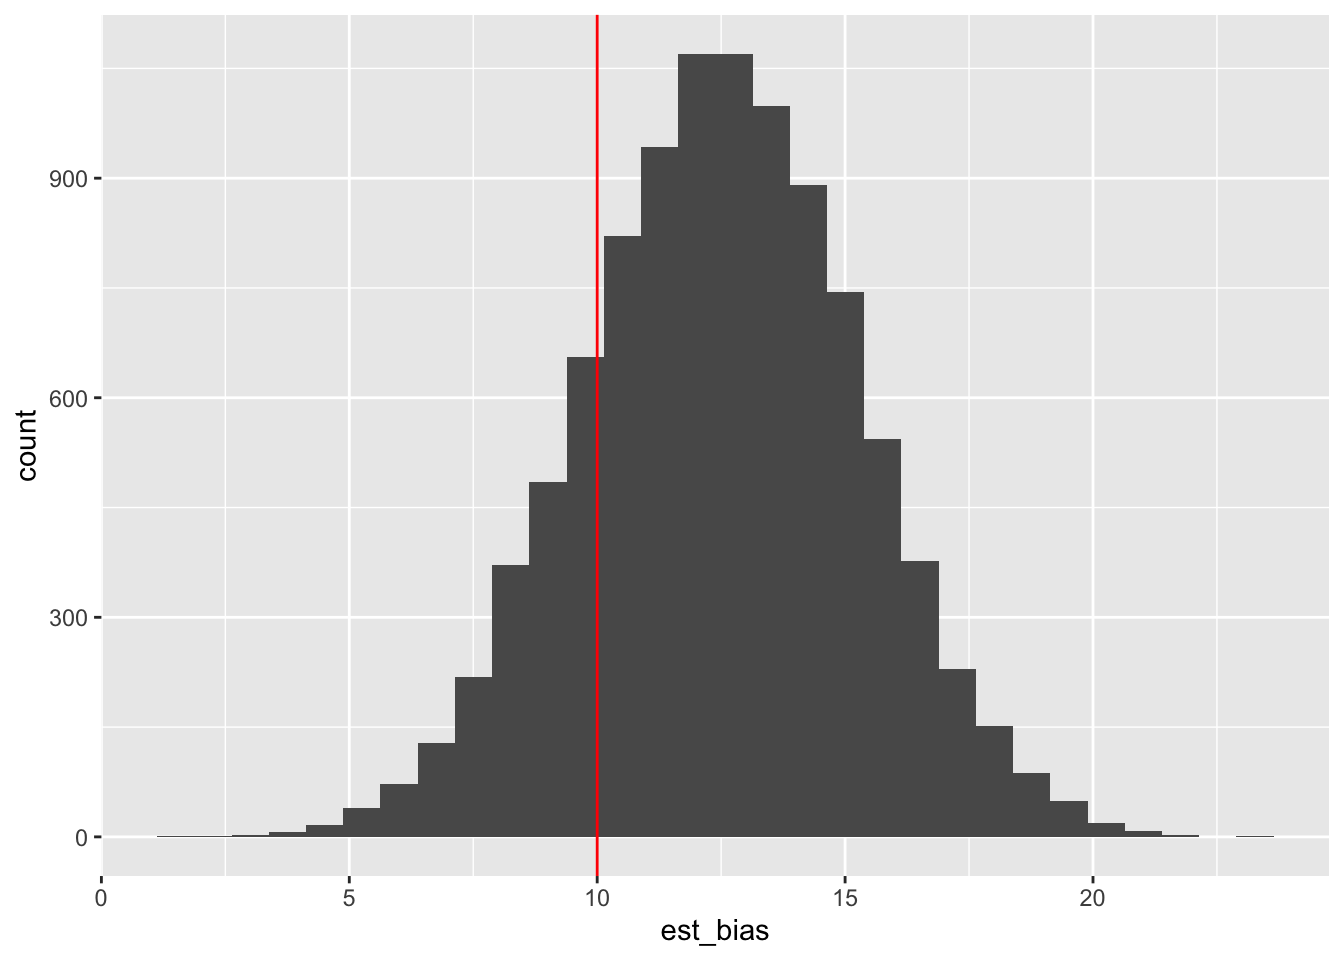
# repeat 10000 timesset.seed(123)est_bias <-replicate(10000, Y_tilde(rnorm(5, mean =10, sqrt(25))))df <-tibble(est_bias = est_bias)df %>%ggplot(aes(x = est_bias)) +geom_histogram() +geom_vline(xintercept =10, color ="red")
`stat_bin()` using `bins = 30`. Pick better value with `binwidth`.
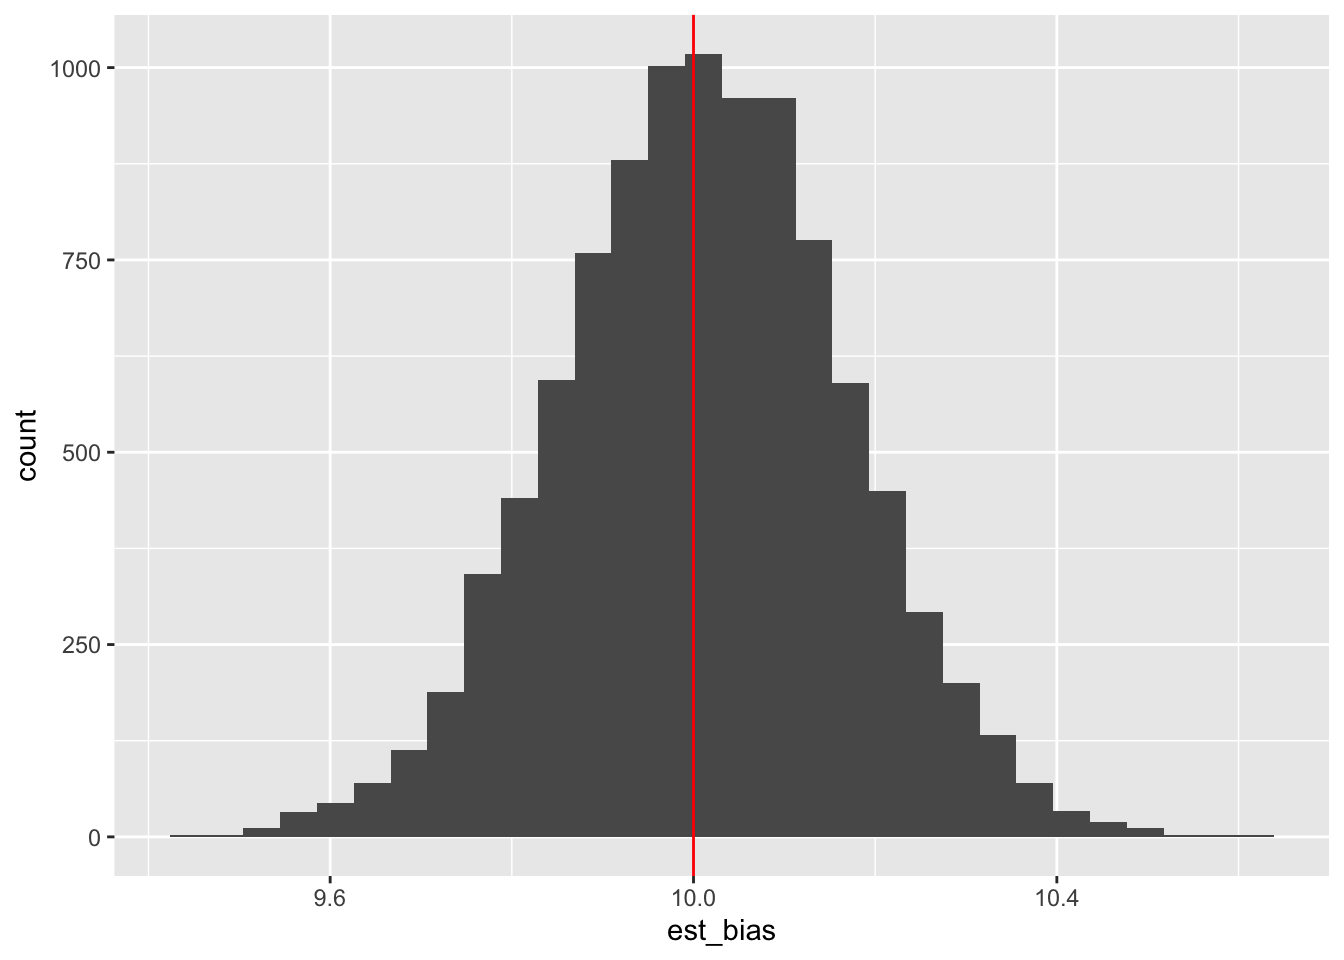
Vamos repetir o exercício com amostrar maiores de 1000 elementos por amostra:
# repeat 10000 times para amostras de tamanho 1000set.seed(123)est_bias <-replicate(10000, Y_tilde(rnorm(1000, mean =10, sqrt(25))))df <-tibble(est_bias = est_bias)df %>%ggplot(aes(x = est_bias)) +geom_histogram() +geom_vline(xintercept =10, color ="red")
`stat_bin()` using `bins = 30`. Pick better value with `binwidth`.
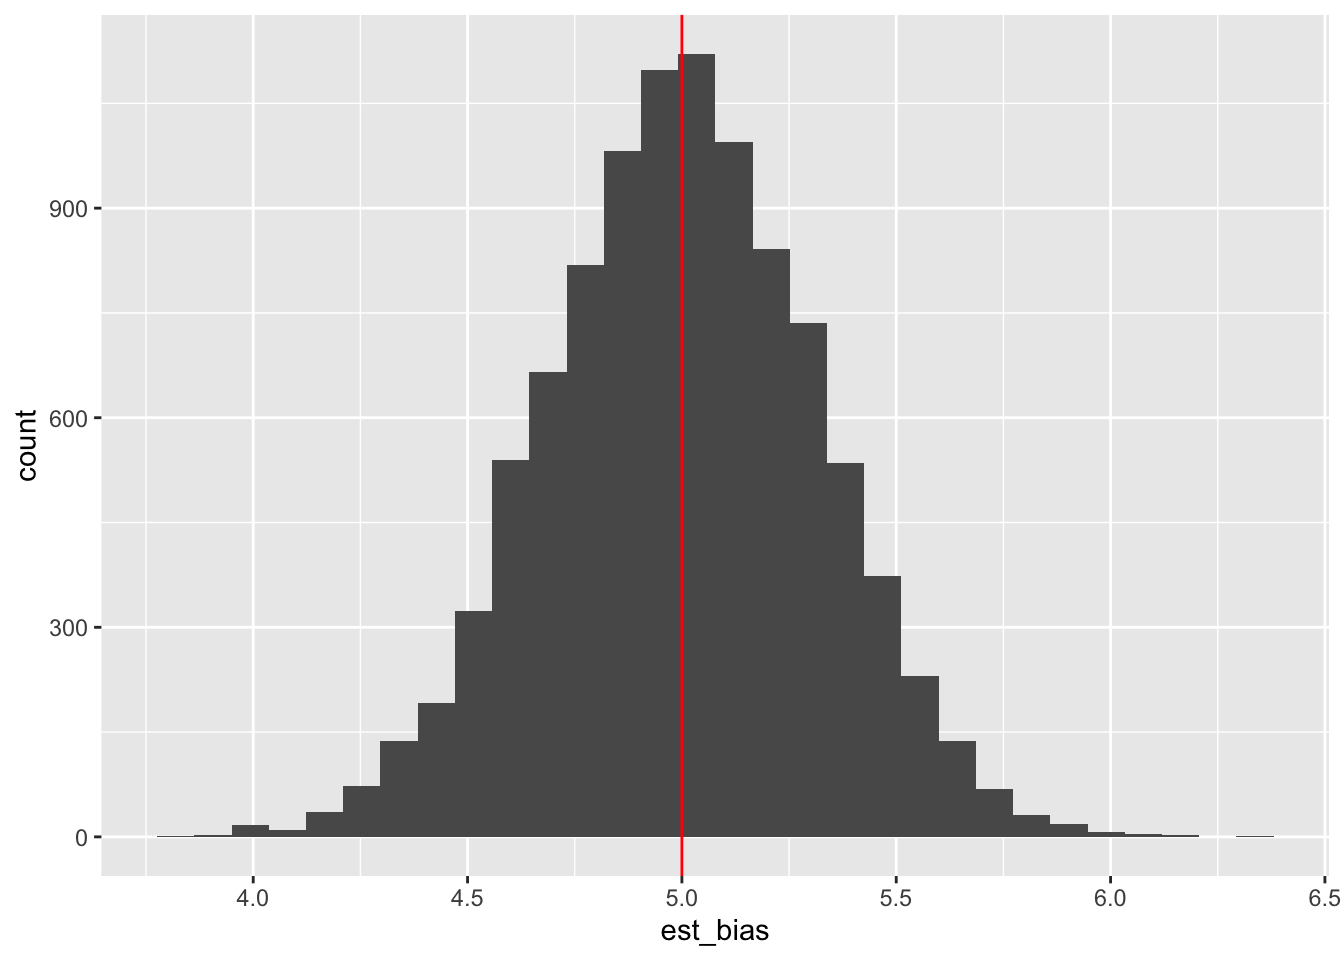
Exemplo - Eficiência de um Estimador
Um estimador é eficiente se os pesos somados resultam em 1.
y_tilde1 <-function(y) { (1/length(y))*sum(y)}set.seed(123)est_bar1 <-replicate(10000, y_tilde1(rnorm(100, mean =5, sqrt(10))))df <-tibble(est_bias = est_bar1)df %>%ggplot(aes(x = est_bias)) +geom_histogram() +geom_vline(xintercept =5, color ="red")
`stat_bin()` using `bins = 30`. Pick better value with `binwidth`.
var(est_bar1)
[1] 0.09953755
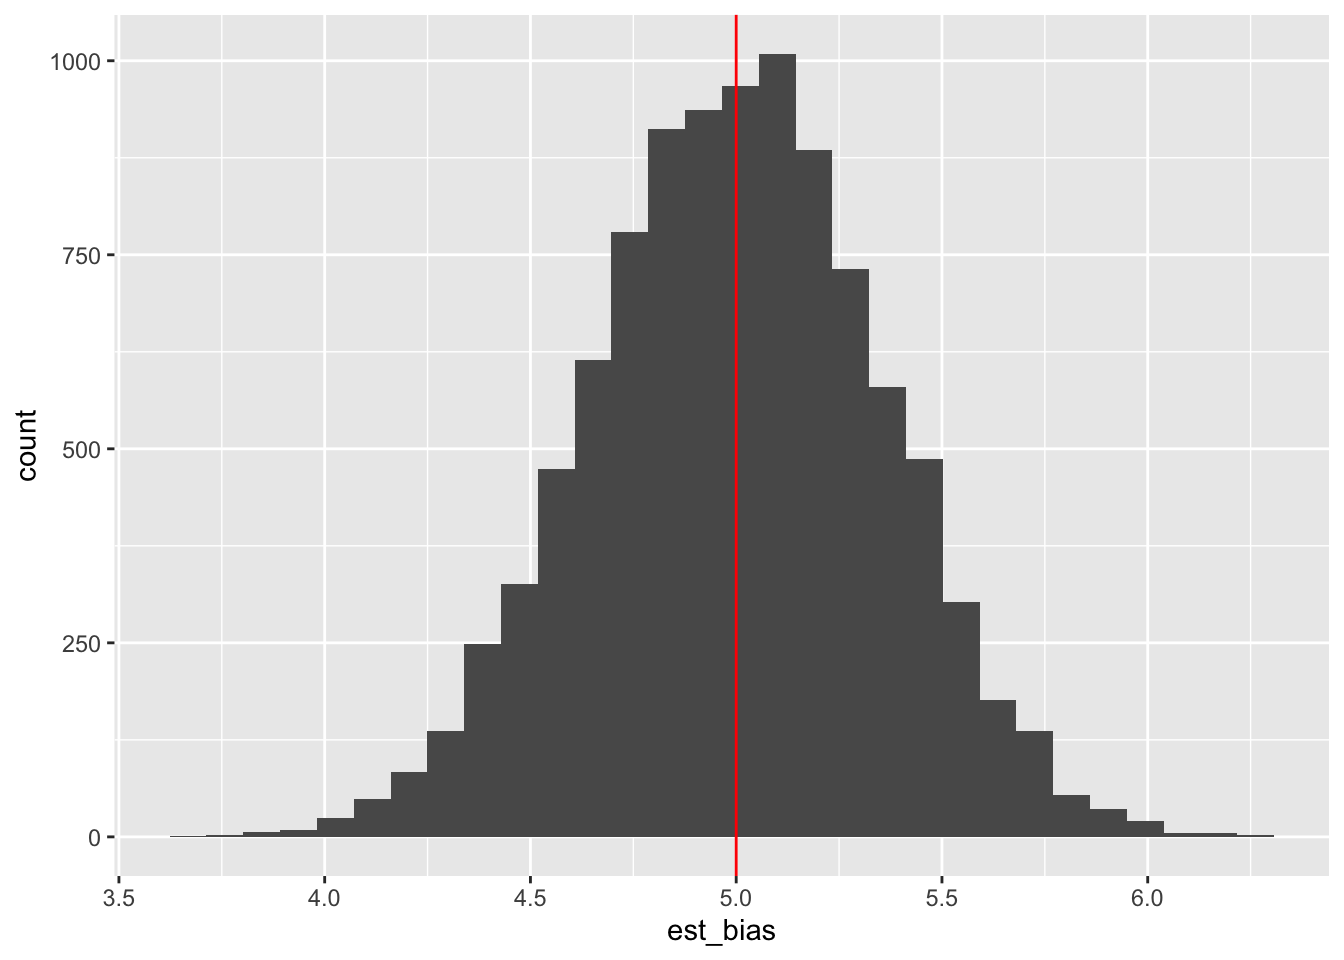
Usando pesos diferentes para os 50 primeiros e 50 últimos.
n =100w =c(rep((1+0.5)/n, n/2), rep((1-0.5)/n, n/2))y_tilde2 <-function(y) {sum(w*y)}est_tilde2 <-replicate(10000, expr =y_tilde2(rnorm(100, mean =5, sqrt(10))))df <-tibble(est_bias = est_tilde2)df %>%ggplot(aes(x = est_bias)) +geom_histogram() +geom_vline(xintercept =5, color ="red")
`stat_bin()` using `bins = 30`. Pick better value with `binwidth`.
var(est_tilde2)
[1] 0.1248949
Citation
BibTeX citation:
@misc{abreu2021,
  author = {Abreu, Marcos},
  title = {Estimadores},
  date = {2021-06-10},
  url = {https://abreums.github.io/posts/2021-06-10-estimadores/},
  langid = {pt-br}
}