
```{r}
#| warning: false
#| error: false
library(tidyverse)
```Here is a list of basic curves drawn with ggplot2.
the graphic:
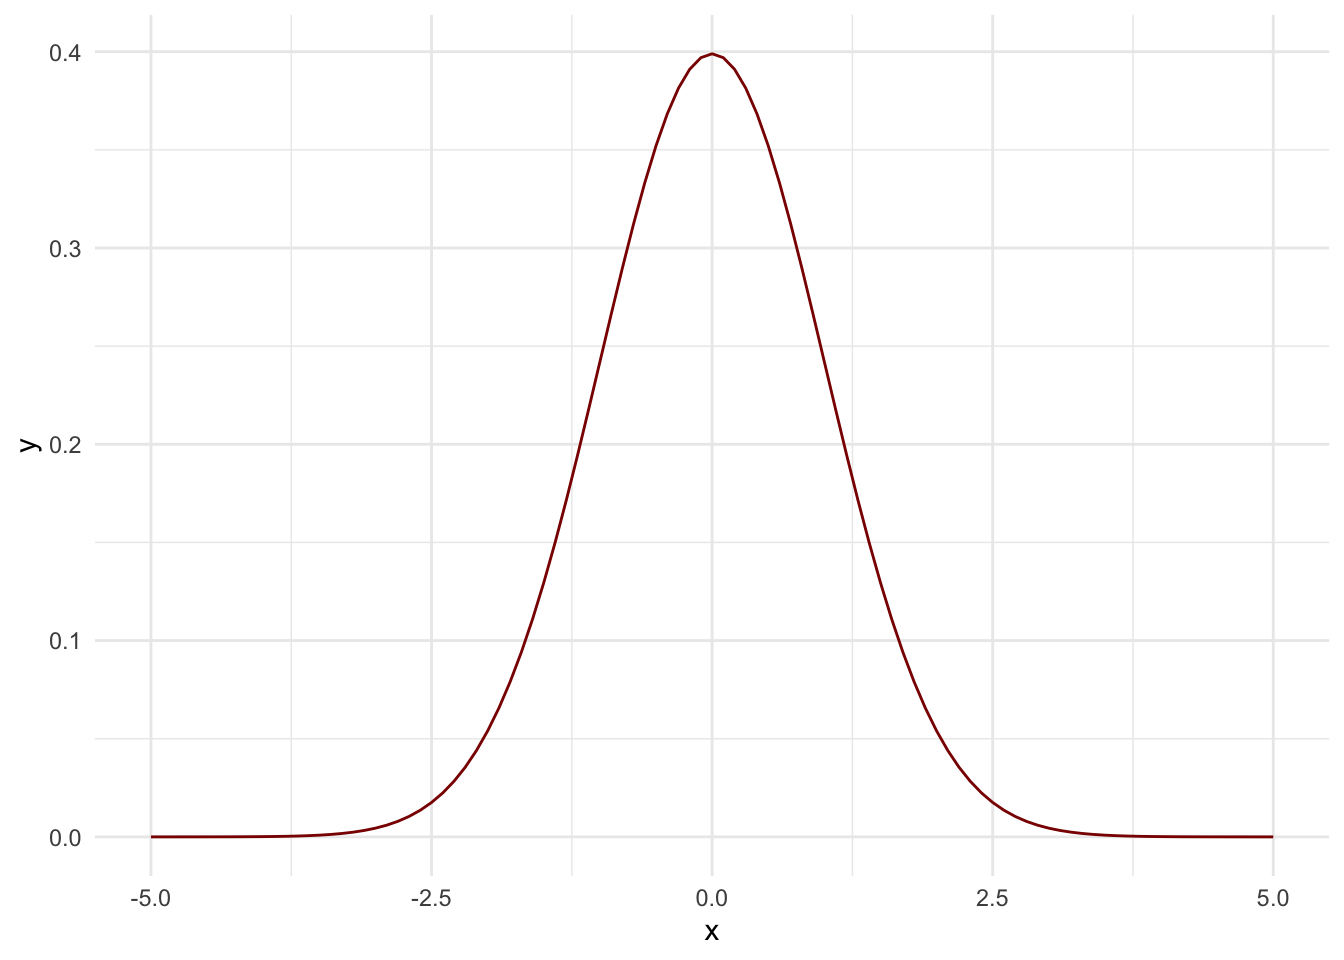
Normal Distribution
We can draw the normal curve changing the stat_function of the graphic:
```{r}
#| warning: false
#| error: false

normal_curve_plot <-
  ggplot(tibble(x = c(-5, 5)),
         aes(x = x)) +
  stat_function(fun = dnorm, color = "darkred") +
  theme_minimal()
normal_curve_plot
```
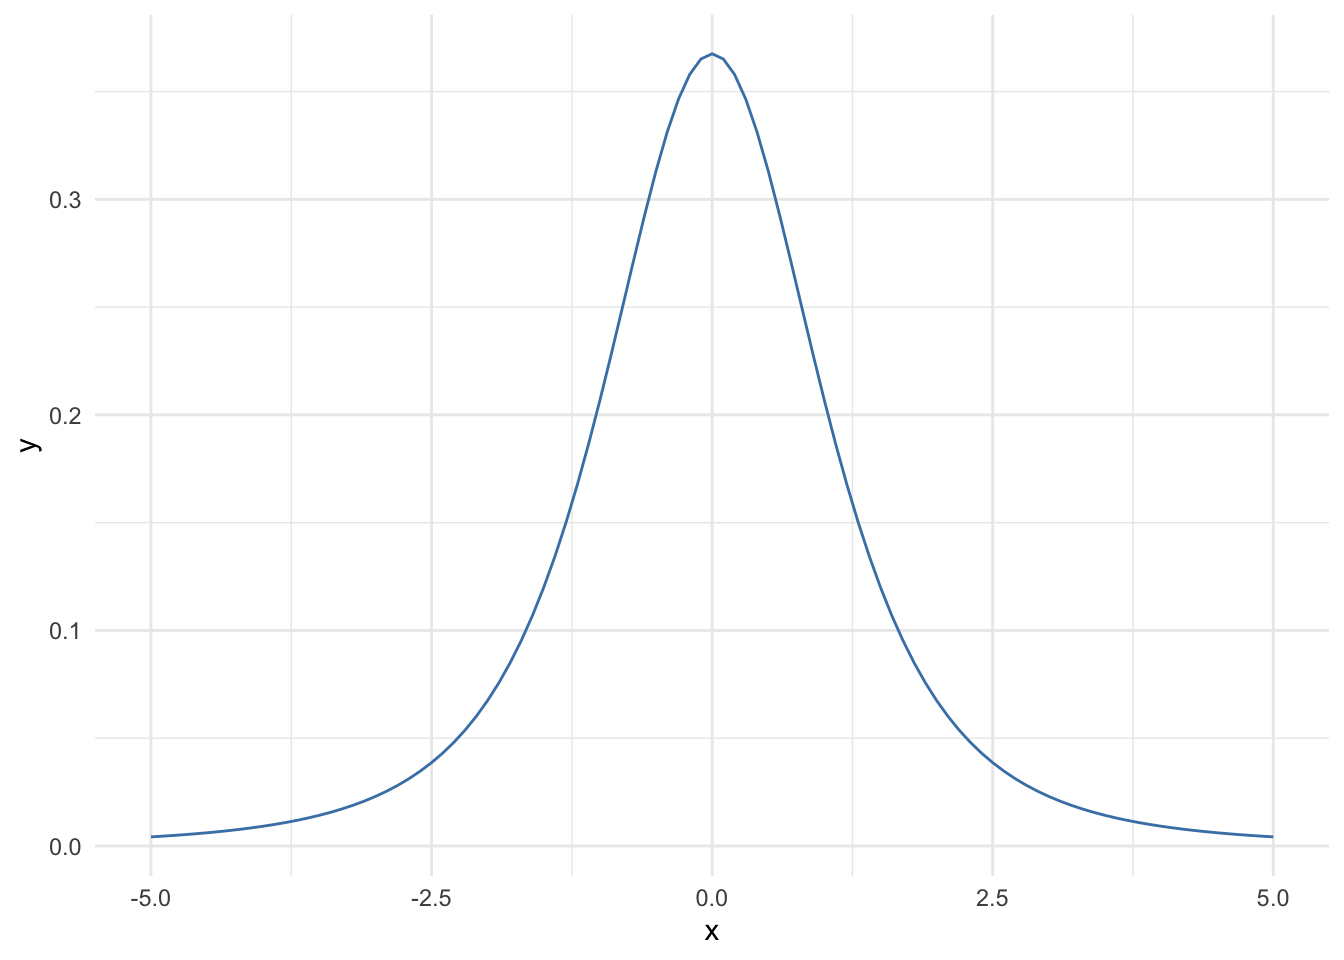
Student Distribution
For the student distribution we need to define the function and the degree of freedom (df):
```{r}
#| warning: false
#| error: false

t_curve_plot <-
  ggplot(tibble(x = c(-5, 5)),
         aes(x = x)) +
  stat_function(fun = dt, args = list(df = 3), color = "steelblue") +
  theme_minimal()
t_curve_plot
```
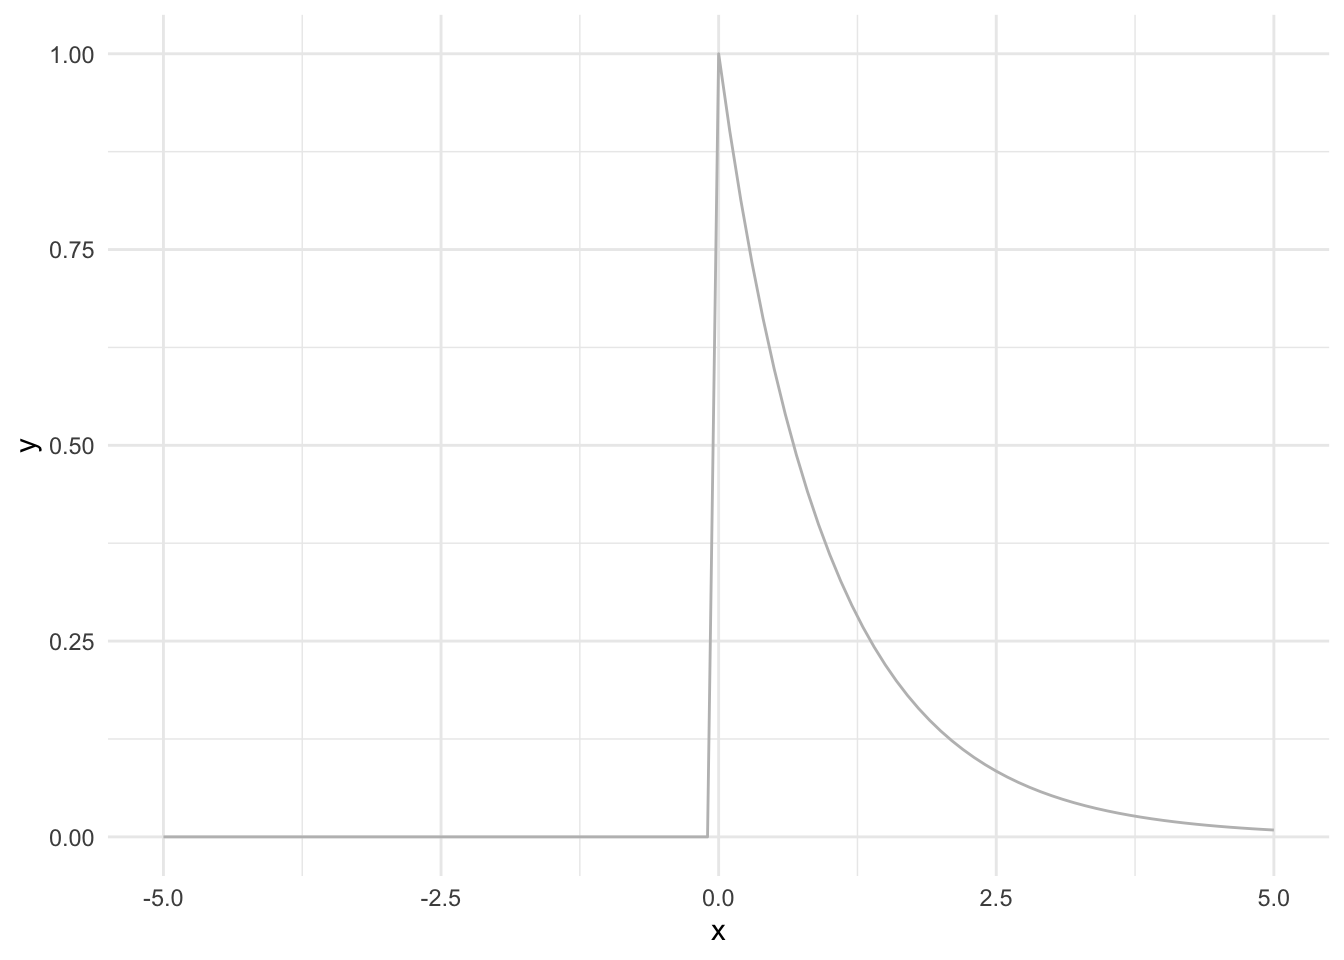
F Distribution
For the F distribution we need to define the function and the 2 degree of freedom parameters (df1 and df2):
```{r}
#| warning: false
#| error: false

f_curve_plot <-
  ggplot(tibble(x = c(-5, 5)),
         aes(x = x)) +
  stat_function(fun = df, args = list(df1 = 2, df2 = 50), color = "gray") +
  theme_minimal()
f_curve_plot
```
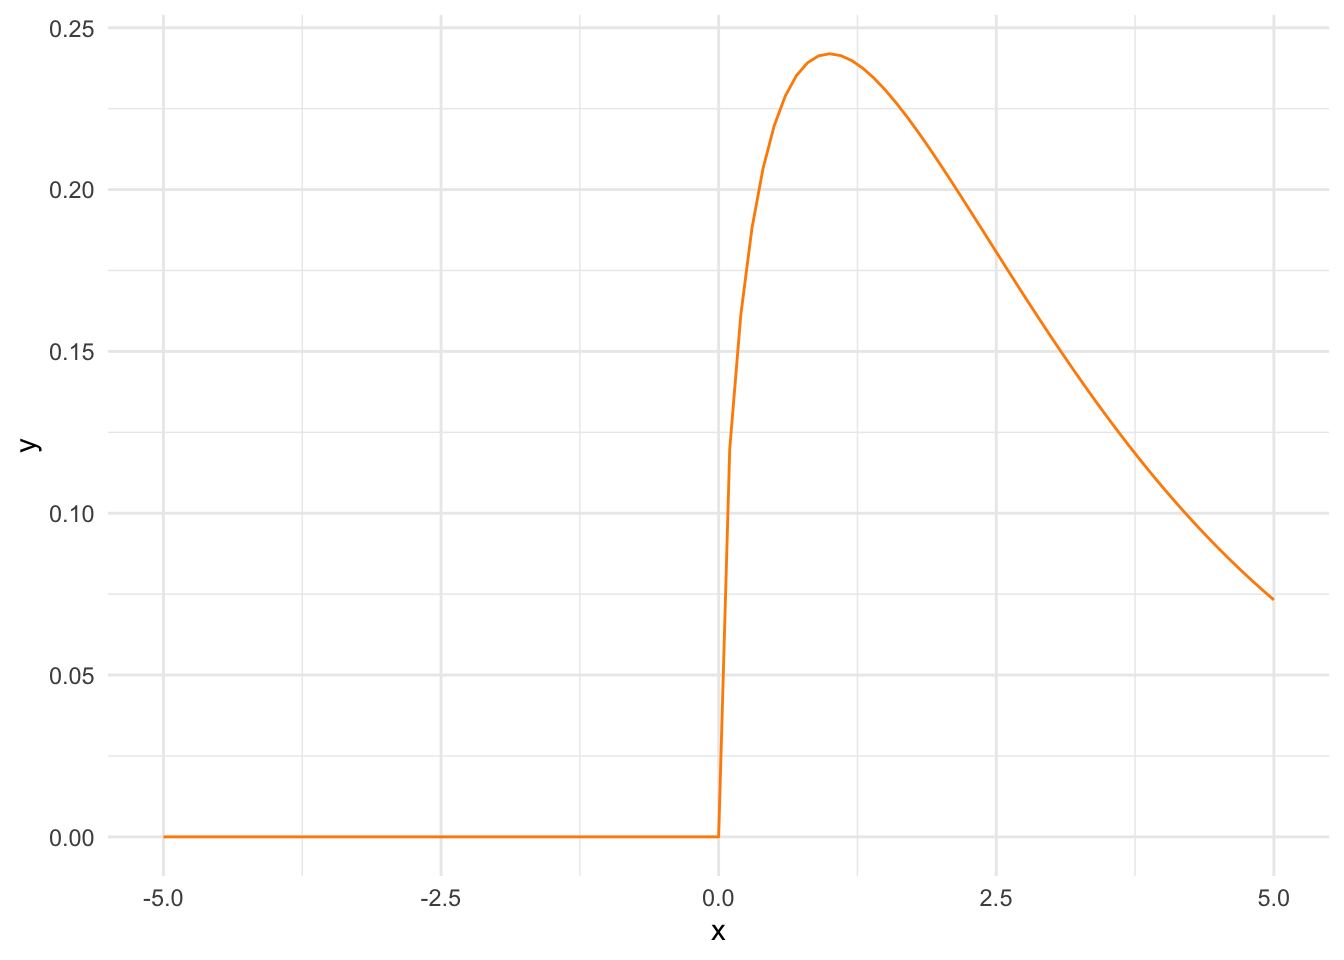
Chi-Squared Distribution
For the chi-squared distribution we need to define the function, the degree of freedom (df), and the non-centrality parameter (ncp):
```{r}
#| warning: false
#| error: false

chi_curve_plot <-
  ggplot(tibble(x = c(-5, 5)),
         aes(x = x)) +
  stat_function(fun = dchisq, args = list(df = 3, ncp = 0), color = "darkorange") +
  theme_minimal()
chi_curve_plot
```
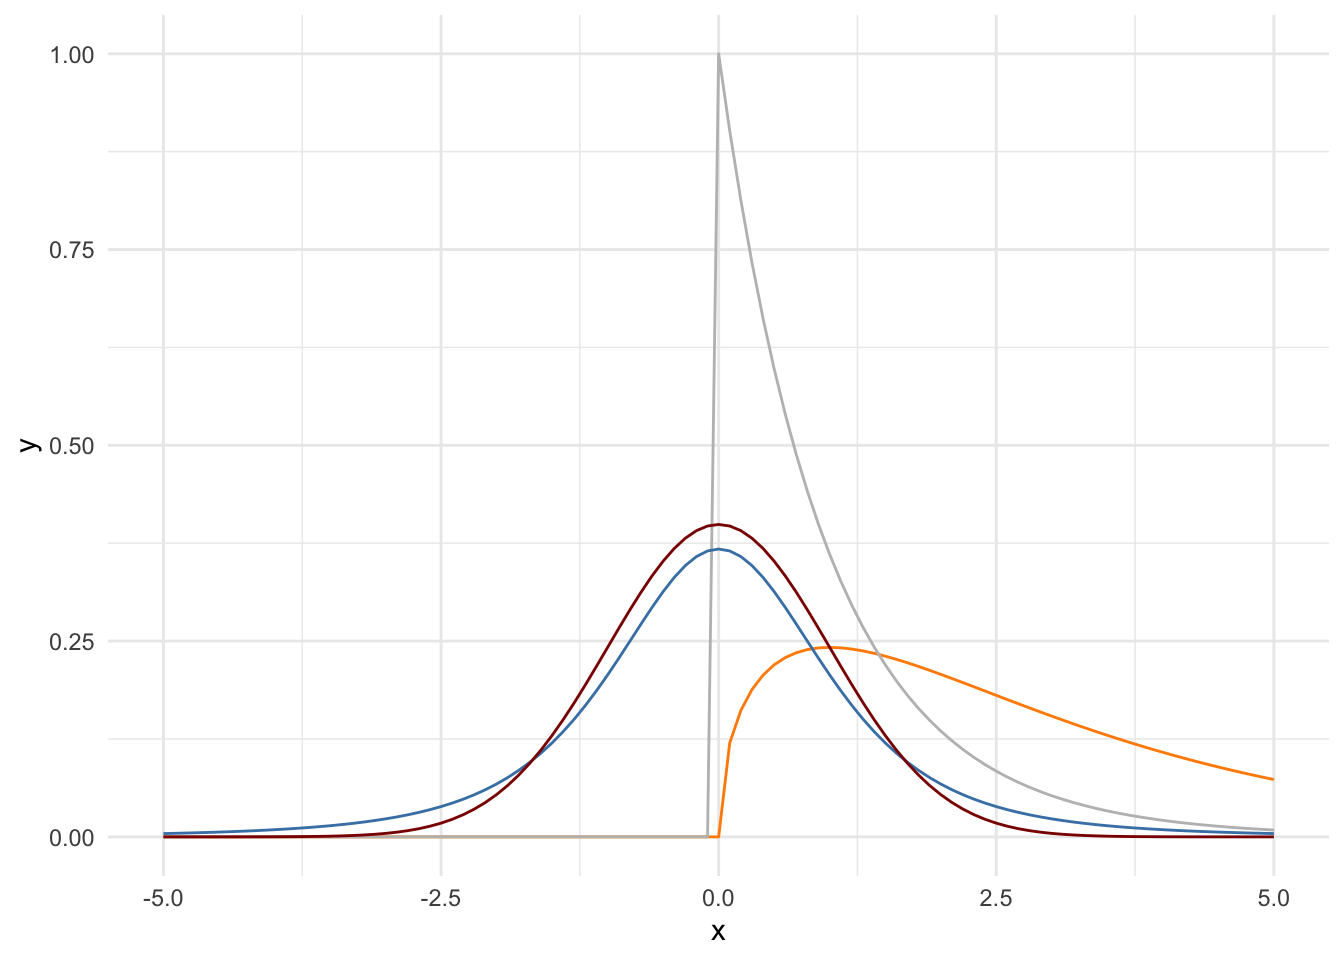
All together
All together now.
```{r}
#| warning: false
#| error: false

all_curve_plot <-
  ggplot(tibble(x = c(-5, 5)),
         aes(x = x)) +
  stat_function(fun = dchisq, args = list(df = 3, ncp = 0), color = "darkorange") +
  stat_function(fun = df, args = list(df1 = 2, df2 = 50), color = "gray") +
    stat_function(fun = dt, args = list(df = 3), color = "steelblue") +
  stat_function(fun = dnorm, color = "darkred") +
  theme_minimal()
all_curve_plot
```
Citation
BibTeX citation:
@misc{abreu2022,
  author = {Abreu, Marcos},
  title = {Basic curves with ggplot},
  date = {2022-05-02},
  url = {https://abreums.github.io/posts/2022-05-02-ggplot-curves/},
  langid = {pt-br}
}
For attribution, please cite this work as:
Abreu, Marcos. 2022. “Basic curves with ggplot.” May 2,
2022. https://abreums.github.io/posts/2022-05-02-ggplot-curves/.